
Don't Just See the Data. Get the Verdict.
Intrinsiqq is your all-in-one stock workstation. Analyze individual stocks or track your whole portfolio, all from SEC data, not opinions.
Free stock analysis. No account. No credit card.
Or navigate directly to some of our most popular stocks:


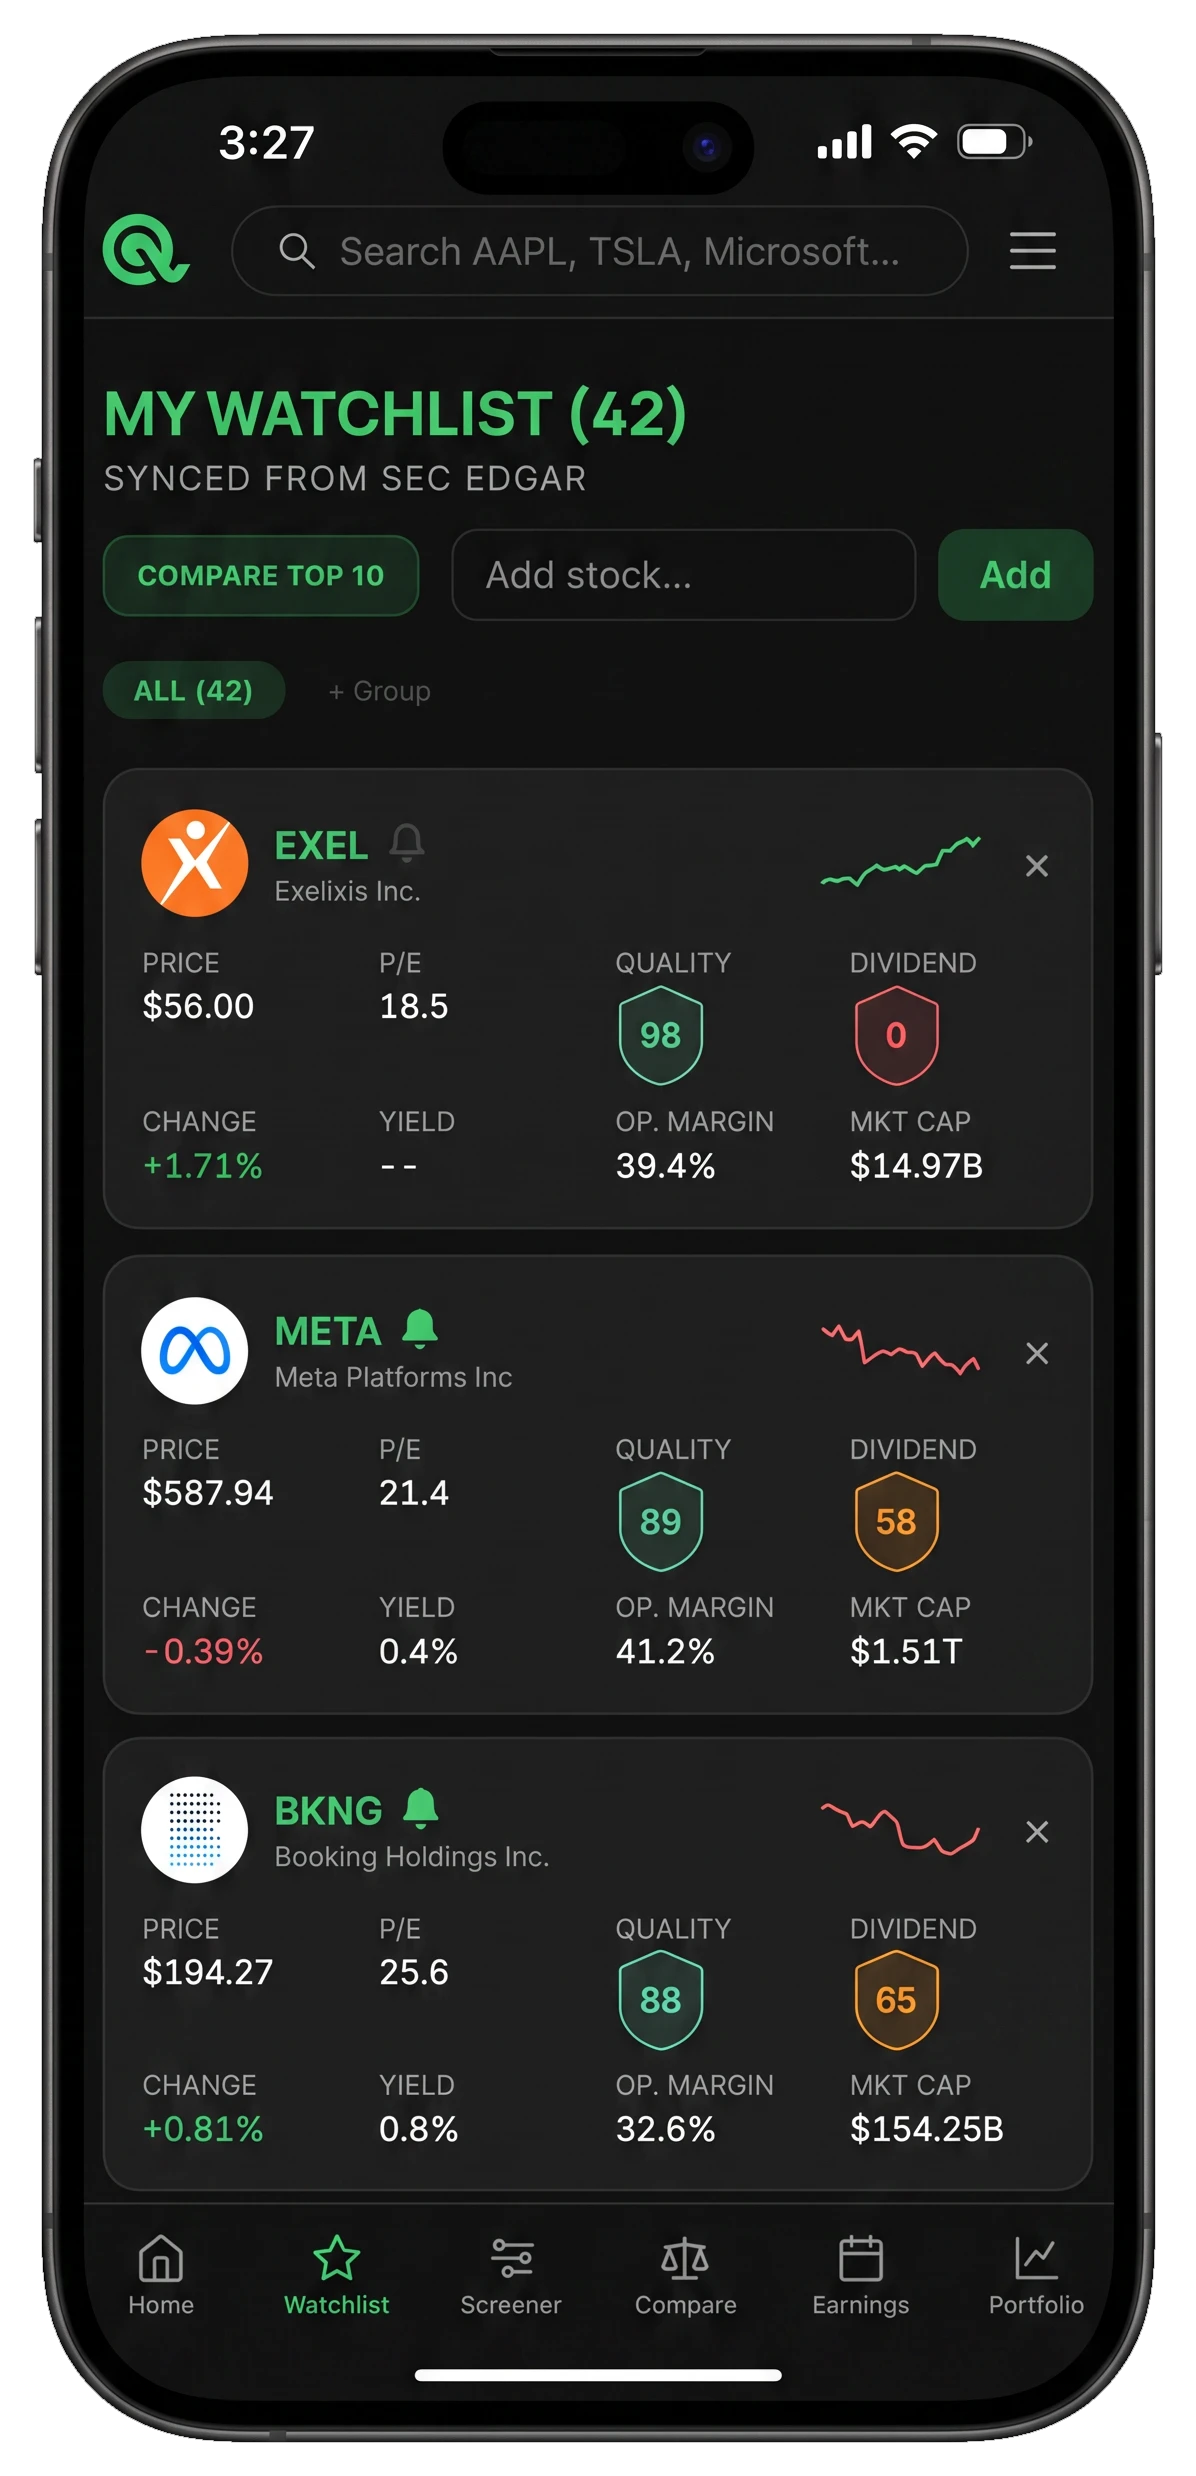
Built for DIY investors who want data, not opinions. Join thousands of investors analyzing stocks with Intrinsiqq.
0+
Global stocks covered
0+ Years
SEC financial data
Daily
Updated from EDGAR
0%
Free, no signup
4.9 from investor reviews
Quality Scores That Actually Mean Something
8 checks on valuation, growth, margins, and balance sheet strength. The same rules for every stock, computed straight from SEC filings.
See a Live Quality ScorecardAug 6, 2026 snapshot· Click any ticker for live scores
Exceptional quality
Weighted blend of 8 checks, 0–100
Fair Value, Not Wishful Thinking
Three fair-value scenarios with every assumption editable. See what growth rate the market is pricing in, then decide if you believe it.
Open the DCF CalculatorAug 6, 2026 snapshot· Default assumptions, fully editable on the live page
Current price
$211.94
vs base case
-13%
Algorithmic estimates from SEC filings. Not a price target or buy/sell advice.
Reviews
Why Investors Rate Intrinsiqq 5 Stars.
Fundamentals, valuation, dividends and earnings in one place, with every number showing its working. Real reviews from investors on X, quoted with their permission.
 Stocker-Man@TheStockerMan
“Intrinsiqq has been one of the most useful investing tools I've come across. I like how it brings together company fundamentals, valuation metrics, and earnings information in a clean, easy-to-understand format, which saves me a lot of research time. It's become part of my workflow when analyzing stocks.”
 Luke Bruni Invests@LukeBruni17
“I highly recommend Intrinsiqq to anyone that wants to go deep into a company he likes. The comprehensive dividend metrics are really good and give me all the data I could ask for. My favorite feature, however, is the possibility to completely customize 100% of the charts to fit my personal analysis style.”
 Koray Chelikhan@KorayChelikhan
“Intrinsiqq is a fantastic platform that gives you all the data that you need to analyze stocks. It provides detailed analysis on the performance of stocks and if they are a good buy option in the current market. My favorite feature is the Dynamic DCF valuation as I can look at the exact costs and revenue of a company. I highly recommend this app for all serious investors!”
 Investify Daily@InvestifyDaily
“Intrinsiqq has been one of the best tools to see public companies performance based on historics, earning reports and SEC filings. If you are a long term investor this tool is a MUST. Instead of spending hours going through documents you can easily look up your favorite company, filter the data you want to look at and see everything in a visually friendly way.”
 Alpha Owl@AlphaOwlTrading
“I needed an app that could give me company financials and fundamentals all in one place. Intrinsiqq has this and more. Quality charts, helpful comparison tools, I'm always finding new ways to dissect a company on Intrinsiqq. A great added feature is the portfolio tracker which I use to check my daily and monthly gains. Couldn't recommend more.”
 Daan@InvestorDaan
“Intrinsiqq makes fundamental analysis effortless. The quality score and discounted cash-flow model deliver a clear, data-driven view of a company's strength and intrinsic value, while the portfolio tracker lets me monitor the overall quality of my holdings. It's a clean, practical and perfect tool for value investors.”
 The Asian Investor@asianinvestors
“The UI is clean and intuitive, no clunky learning curve to get to what I need. The charting tools are extensive, giving clear technicals/fundamentals instead of a bare bones overlay. And I like how it pulls everything together into a clear overview when I'm screening ideas.”
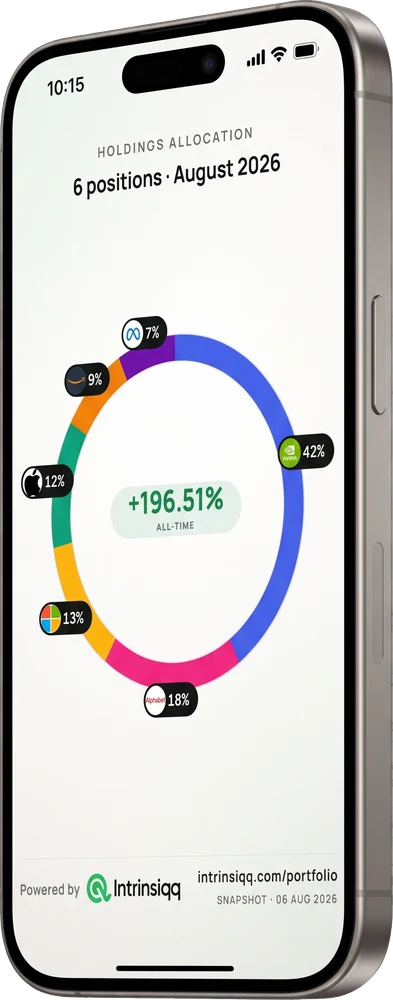
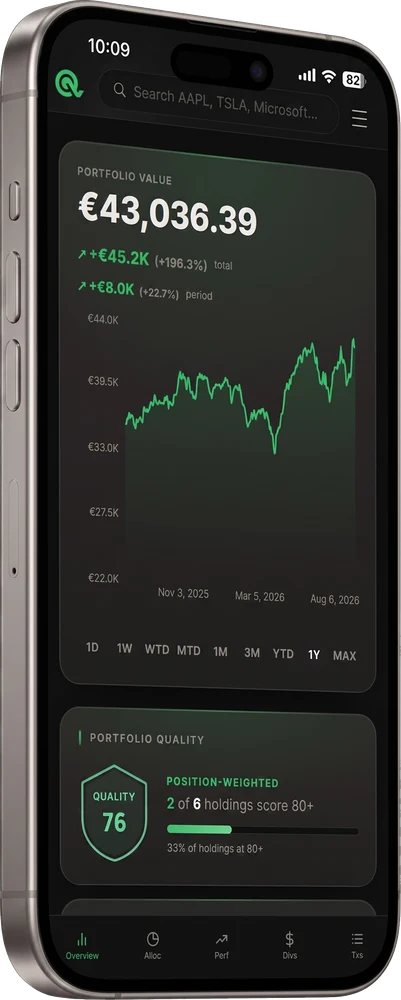
Every Holding, Scored and Tracked
Track cost basis, real returns and dividend income across every position. Then see the quality score of your portfolio as a whole, not just its performance.
Aug 6, 2026 snapshot
Find the Businesses Worth Your Time
Filter 10,000+ stocks by quality score, valuation, margins, growth and balance-sheet strength. Start from a quick screen or build your own.
Aug 6, 2026 snapshot
Quick screens
| Company | P/E | Op. margin | ROIC | Quality |
|---|---|---|---|---|
| 19.6 | 41.2% | 24.9% | 89 | |
| 13.2 | 51.2% | 20.2% | 88 | |
| 12.6 | 36.1% | 39.3% | 88 | |
| 18.8 | 65.6% | 60.0% | 83 | |
| 31.8 | 58.3% | 60.0% | 81 | |
| 57.8 | 34.4% | 46.7% | 81 |
Or build your own from 30+ filters across scores, valuation, profitability, growth, returns, dividends and size.
Line Up Any Stocks, Side by Side
Put up to 10 tickers on one chart and switch the metric underneath them. Scores, valuation, margins, growth and cash flow, with the winner on each measure called out, so the answer is one glance away.
AAPL vs MSFT vs NVDA
— Quality ScoreHigher is betterAug 6, 2026 snapshot· Real filed figures from SEC EDGAR · TTM where applicable
Meta Platforms Annual Revenue
META
Aug 6, 2026 snapshot· Real filed figures and closing prices from SEC EDGAR
Chart Any Metric, Any Way You Want
Stack up to four metrics, switch between area, line, bar, stacked and combo, flip annual to quarterly or per-share to year-over-year, and lay share price or the P/E multiple over the top. This is the real thing, running on filed figures.
Every Score Is Transparent
No black boxes. See exactly how each score is calculated: the formulas, the thresholds, and the pass/fail checks. If you disagree with a weight, you'll know why we chose it.
Not a buy/sell signal. A faster way to judge quality, valuation, and trend using SEC fundamentals.
Built by a long-term investor who got tired of bouncing between Yahoo Finance, spreadsheets, and $200/mo terminals.
Simple Pricing for Serious Investors
Professional tools shouldn't come with amateur confusion. Choose the plan that fits your strategy.
Free
- 10 stock lookups / day
- 10 watchlist stocks
- 5 years financials
- 10 price alerts
- Page access:
- Dividend Score
- DCF Valuation (view only)
- Fundamental Charting (single metric, 5 years)
- Chart export (PNG, JPG, PDF)
- Watchlist
- Earnings Calendar
Pro
Billed annually ($115.08/yr)
- Unlimited screener runs, top 100 results
- Unlimited comparisons, 10 stocks each
- Unlimited stock lookups
- 1 watchlist, unlimited stocks
- Full financial history, all available years
- Editable DCF sliders
- Advanced charting: price & valuation overlays, multi-metric
- 20+ years of history & saved chart templates
- 20 price alerts
- PDF stock summary
Premium
Billed annually ($268.68/yr)
- Everything in Pro, unlimited
- Unlimited watchlists, not just one
- Unlimited alerts
- Portfolio Tracker with unlimited portfolios and holdings
- Position-weighted portfolio quality score
- Portfolio fundamentals radar across 5 dimensions
- Dividend calendar plus 12-month income forecast
- Custom quality score weights
Cancel anytime • No credit card required to start free
Frequently Asked Questions
Is this a buy or sell signal?
No. Intrinsiqq scores business quality, valuation, and trend strength to help you make more informed decisions. It is not investment advice and does not tell you when to buy or sell.
Where does the data come from?
All financial data comes directly from SEC EDGAR filings, the same source institutional investors use. Stock prices come from licensed market data providers. Data is updated daily.
How is the quality score calculated?
The quality score blends 8 metrics, each scored 0 to 100, across valuation, growth, margins, capital efficiency, and balance sheet strength. The overall score is a weighted average of those metric scores. Every formula, threshold, and weight is documented on our methodology page.
Can I edit the fair value assumptions?
Yes. The DCF model lets you adjust growth rates, discount rate, terminal growth, and margin of safety across three scenarios (conservative, base, optimistic).
Who is this for?
Self-directed investors who think long-term and want a fast first-pass on whether a business is quality and fairly priced. Not designed for day traders, options strategies, or meme stock speculation.
Does it work for all sectors?
It works best for companies with regular SEC filings and meaningful cash flows, most industrial, tech, healthcare, and consumer businesses. Banks, REITs, and pre-revenue companies may have less meaningful scores.
Do I need an account?
No. Just type a ticker and go. No signup, no email, no credit card. The watchlist feature uses local browser storage.
Why use this instead of Yahoo Finance or a spreadsheet?
Yahoo gives you raw data. Spreadsheets take hours. Intrinsiqq gives you an instant scored verdict: quality, valuation, and trend, from the same SEC data, in seconds.
Search any stock.
Get a quality score, fair value estimate, and 10+ years of financials. In seconds.
No account required • No credit card • 100% free